
Technical debt is the enemy of agility.
Not process. Not frameworks. Not the tools you choose or the ceremonies you hold. Agility is sustained change capacity, and technical debt is the dominant force that erodes it over time.
I built a technical debt simulator to make this visible. Not because the math is complicated, but because our intuition is systematically wrong. Teams consistently underestimate how quickly debt compounds, how dramatically small changes in friction affect outcomes, and how strategies that feel reasonable can lead to catastrophic results.
This is the first article in a series exploring what the simulator reveals about technical debt, refactoring strategies, and the structural choices that determine whether teams maintain their ability to change or slowly grind to a halt.
Agility is the ability to turn, not to ship
There’s a definition of agility I’ve come to rely on because it cuts through most of the noise. Kyle Griffin Aretae describes one of its core constraints this way: agility requires the ability to change direction quickly, safely, and cheaply. Not velocity. Not throughput. Not the number of features shipped per quarter.
This distinction matters because most organizations measure the wrong thing. They track output: stories completed, features deployed, commits merged. They celebrate teams that ship fast, promote leaders who deliver on time, and reward engineers who churn through backlogs.
None of that measures agility. A team can ship fast while losing its ability to change. A team can hit every deadline while becoming progressively more brittle. Output is visible; capacity is not.
Agility requires preserved change capacity: the ability to respond to new information, pivot when markets shift, experiment with alternatives, and incorporate what you learn. When that capacity erodes, you don’t notice immediately. The team still ships. The metrics still look fine. The dashboard still shows green.
Until it doesn’t.
The cost of looking productive
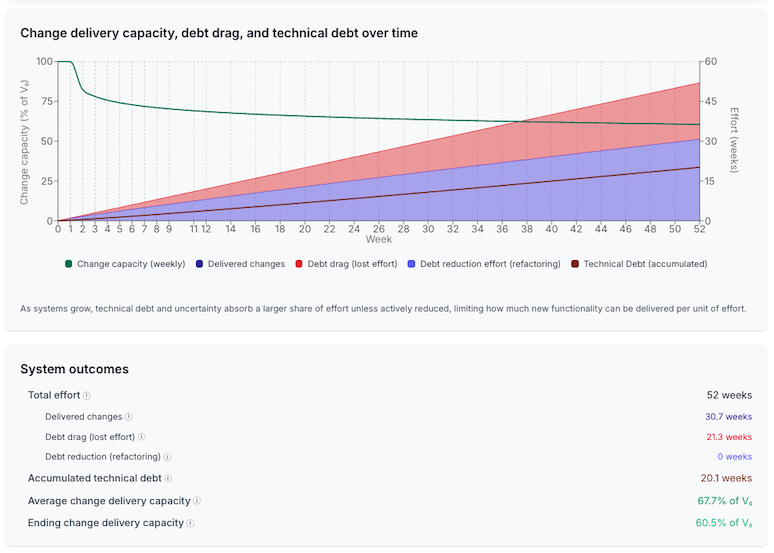
Most organizations think they know what productivity looks like: features shipped, deadlines met, roadmaps delivered. The problem is that those signals are incomplete and they become more misleading over time. Run the simulator with the Baseline preset to see this in action.
The results can look deceptively acceptable if you’re measuring output. The team delivers 30.7 weeks of changes over the year. That’s just under 60% of total effort converted into delivered work. On paper, this looks like acceptable productivity. In reality, it’s the system quietly trading future capacity for present optics.
And that’s before accounting for meetings, incidents, planning, coordination, or any of the operational work real teams can’t avoid. In other words, this is already a failure mode and one that simply doesn’t show up on standard dashboards. In any other capital-intensive system, losing this much effective capacity without recognizing it would be treated as a serious control failure. In software, we call it “shipping”.
Now look at what’s hidden beneath that output. Accumulated technical debt reaches 20.1 weeks by year end. Debt drag, which is effort lost to working around accumulated complexity, consumes 21.3 weeks of capacity. By the end of the year, the team has lost nearly 40% of its effective change delivery capacity.
This is the cost of looking productive: output appears steady while the system’s ability to absorb change quietly collapses. The team doesn’t start at perfect efficiency; structural drag is present from day one. But by year end, even that already-taxed capacity has eroded dramatically. Every iteration going forward will be harder than the last. Every feature will take longer. Every change will carry more risk.
The CEO sees delivered features. The board sees throughput metrics. Both see productivity. Neither sees the cost. Decisions made on lagging indicators systematically favor short-term output over long-term adaptability. Engineering sees the system becoming progressively harder to change.
Horizon bias and incentive alignment
Why do organizations consistently make choices that erode change capacity?
The answer isn’t stupidity or malice. It’s horizon bias: leaders optimize for visible output inside their promotion timelines, and the costs of that optimization land on their successors.
A VP who ships features aggressively for 18 months and then moves to their next role gets promoted based on output. The VP who inherits their codebase inherits the debt.
This isn’t a bug in how we evaluate leaders; it’s a structural feature of how incentives align with time horizons. Importantly, this behavior doesn’t require bad intent. Even leaders who care deeply about long-term health are constrained by metrics, promotion cycles, and market pressure. When success is measured quarterly and ownership turns over every few years, decisions that trade future capacity for present output are not moral failures. They are predictable system responses.
Deferred refactoring is locally rational and globally destabilizing. The person who makes the decision benefits from the short-term velocity gain; the person who lives with the consequences pays the compounding interest. Industry research shows technical debt represents 20-40% of the value of an organization’s entire technology estate. That’s not a codebase problem; that’s an enterprise problem.
Deferred refactoring is a fairytale with beneficiaries
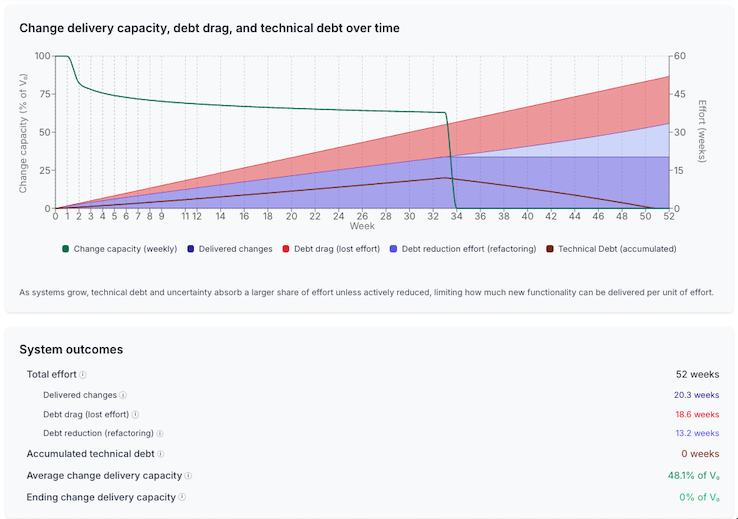
Run the simulator with the Backloaded Refactoring preset. This is the strategy many organizations actually follow: ship features now, defer cleanup until “later.”
In this scenario, the team focuses on building features for 34 weeks straight, then switches to pure refactoring for the remaining 18 weeks. The logic sounds reasonable: get the product out, then clean up the mess.
The results are catastrophic.
- Delivered changes: 20.3 weeks. Less than two-thirds of the baseline!
- Debt drag: 18.6 weeks of lost effort
- Change delivery during cleanup: effectively zero
For nearly five months, the team ships nothing.
The team doesn’t just slow down. To recover, it must halt feature delivery entirely and spend 18 weeks doing nothing but refactoring to get accumulated debt back to zero. Those weeks are not an investment alongside delivery; they replace it.
By the time cleanup begins, the system has accumulated so much debt that meaningful progress is impossible without stopping. The earlier velocity wasn’t free. It was borrowed against future capacity, and the interest comes due all at once.
This is what happens when velocity drops below roughly half of the system’s starting change capacity. Recovery is possible, but only by sacrificing a massive block of delivery time. The strategy collapses under its own economics.
The fairytale of “we’ll clean it up later” has beneficiaries: the people who get credit for the initial velocity. The people who live with the recovery cost are not among them.
The question you should be asking
Most teams ask, “how fast are we shipping?” They track velocity, measure throughput, and celebrate releases.
Those metrics tell you nothing about sustainability. They’re snapshots of output at a moment in time. They don’t reveal whether capacity is growing or shrinking, or whether the team will be able to respond to next quarter’s priorities.
The question that matters is different: “What will our capacity look like next year?” That blind spot matters even more when the pace of change accelerates.
AI removes the buffer
Everything I’ve described gets worse with AI-assisted development.
In the simulator, technical debt does not grow because time passes. It grows because the system is changed. Every change expands surface area, interaction cost, and validation effort. AI doesn’t alter that relationship; it increases the number of changes that happen per unit of time, all for seemingly little additional cost.
AI compresses time, amplifying discipline, or the lack of it, by accelerating the same debt dynamics already in play. Teams that maintain strong practices see AI accelerate their effectiveness. Teams with fragile foundations see AI accelerate their collapse.
As I wrote in my analysis of the 2025 DORA Report, teams saw throughput improve but instability persist or worsen. We’re moving faster without evolving our systems to handle the velocity. We’re generating more code without building the guardrails, feedback loops, and organizational structures needed to manage AI-accelerated development safely.
AI brings the future forward. The buffer you had—that time between “things are getting worse” and “things are broken”—shrinks, by a lot. The consequences of bad strategy arrive sooner and hit harder.
Jules May, in his research on the mathematics of technical debt, demonstrated that a 2% change in friction rate creates massive differences in project outcomes. His financial modeling showed teams paying effective interest rates of 20,000% on technical debt. The simulator makes that abstract math visible at the scale teams actually operate.
AI multiplies whatever friction rate you already have. When the rate of change increases, small differences in friction dominate outcomes faster. What took years to surface now takes months.
Speed without capacity is temporary
In order to thrive long-term, you need to protect your ability to change. Measure capacity, not just output. Invest in adaptability, not just delivery. Sustainable speed comes from stability, not spurts.
Slow is smooth. Smooth is fast. And fast, done right, is sustainable.
In the next article, I explore why most refactoring strategies still fail, and what continuous refactoring achieves that periodic cleanup never can.